Lumiere Luxe — Shopify Store, Analytics Pipeline & BigQuery Dashboard
A fictional beauty ecommerce store built to test a full pipeline end to end — a Shopify storefront, GTM/GA4 tracking, a real webhook-to-database integration, and a BigQuery + Looker Studio analytics layer on top — rather than stopping at the front-end funnel like most of my earlier projects.
The Problem
Most of my earlier projects ended at the front end — a form, a landing page, a lead captured in a CRM. That covers the marketing ops side of what I do, but not the analytics side I'm building toward. I wanted one project that went further downstream: a real storefront with real tracking, a genuine backend integration rather than a mocked one, and an actual SQL and BI layer on top, all tied to the same fictional business end to end. Lumiere Luxe is that project — a fake beauty brand used to build out a Shopify store, wire up GTM and GA4 properly, prove out a real webhook into a database, and then use that data (plus a synthetic dataset for volume) to write SQL and build a dashboard in BigQuery and Looker Studio.
What I Built
- A Shopify dev store on the Dawn theme with a custom color scheme, a hero and promo banner section, and a 12-product catalog split across three collections (Skincare, Makeup, Tools) with auto-populating collection pages.
-
Full GTM/GA4 tracking across the storefront and checkout: storefront events fire through GTM in
theme.liquidas usual, but Shopify's checkout runs in a sandboxed environment where GTM itself won't reliably load — so checkout tracking is implemented as a directgtag.jscall inside a Custom Pixel instead, working around the platform limitation rather than leaving checkout untracked.

-
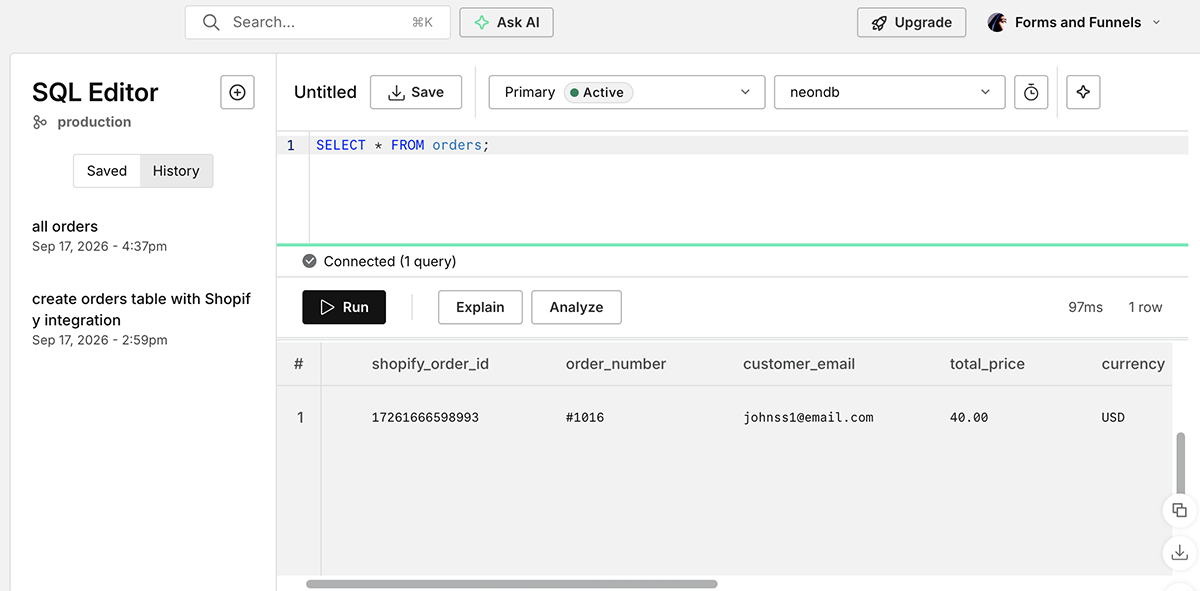
A real webhook integration: Shopify's
orders/createwebhook fires to a small Flask app, which verifies the request's HMAC signature, parses the order payload, and inserts it into a Postgres database — including nested line items stored as JSONB, since an order can hold a variable number of products. - The Flask app is deployed to Render with gunicorn as the production server, backed by a hosted Postgres instance on Neon. The first pass ran locally behind ngrok, then Cloudflare Tunnel, to expose it to Shopify — both hit reliability issues on their free tiers, so the app was deployed to a real (free-tier) host instead, which is also closer to how this would actually be run in production.
-
Since a dev store only generates a handful of real orders and GA4 events, I generated a larger synthetic dataset in Python/pandas — a set of
orders and a matching set of GA4-style events, with purchase events carrying a
transaction_idthat ties back to a specific order — to get enough volume for the funnel and revenue analysis to actually mean something. -
Both datasets were loaded into BigQuery (
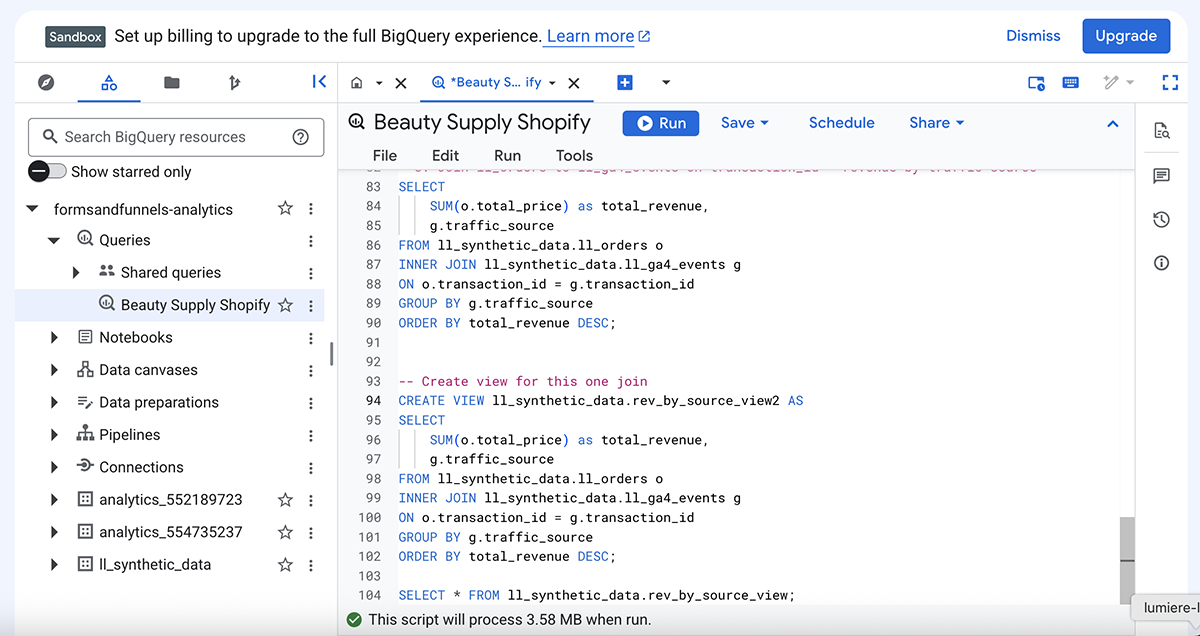
ll_ordersandll_ga4_events), separate from the real GA4 export tied to the live storefront, and used to write SQL covering revenue trends, order status, repeat-customer analysis, session and device breakdowns, and a full funnel from session start through purchase. -
A join between the orders and events tables (on
transaction_id) answers the one question neither table can answer on its own — revenue by traffic source — and is saved as a BigQuery view so Looker Studio can connect to it directly.
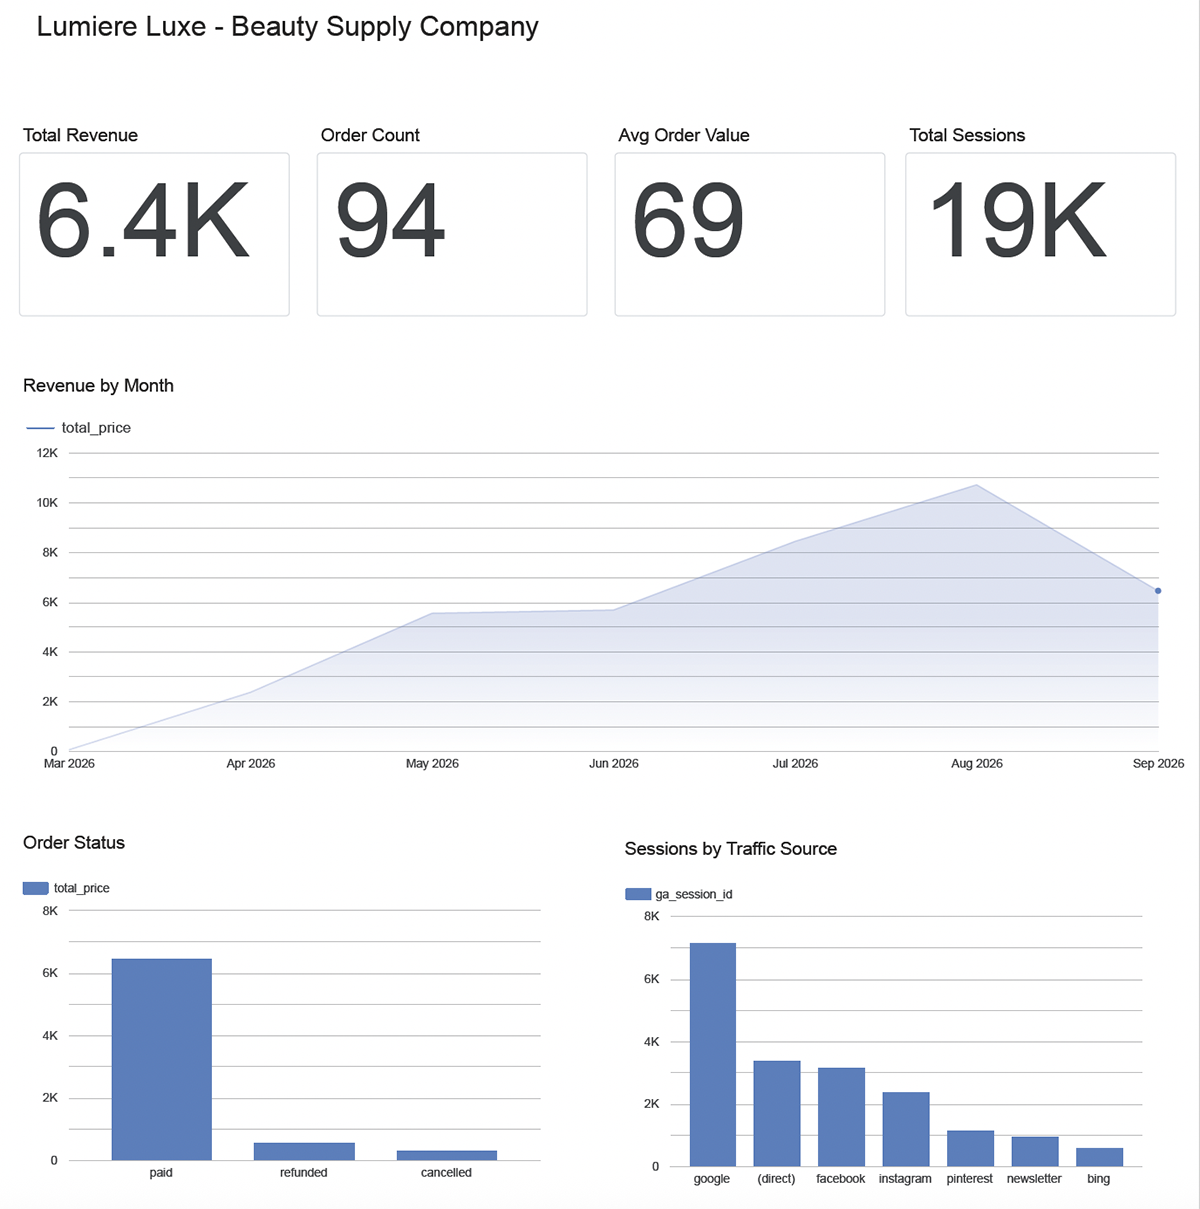
Business questions the dashboard is built to answer:
- What's the monthly revenue and order volume trend?
- What's the average order value for paid orders?
- How many orders are paid, refunded, or cancelled?
- What share of customers are repeat buyers versus one-time?
- Which devices and traffic sources are driving the most sessions?
- Where in the funnel — from session start to purchase — are visitors dropping off?
- Which traffic source is generating the most actual revenue, not just sessions?
Key Decisions
Local tunneling tools kept hitting reliability issues on their free tiers rather than any problem with the webhook logic itself. Rather than keep debugging a tool that wasn't the actual point of the exercise, I deployed the Flask app to Render — which also happens to be closer to how a webhook receiver would actually be run in production.
A dev store realistically only produces a handful of real test orders and events — not enough to show a meaningful trend, funnel, or cohort
pattern. Generating a larger synthetic orders and events dataset, deliberately matched on transaction_id, let the dashboard
demonstrate real analytical patterns without waiting on live traffic that was never going to materialize.
Both stacks are on my list to practice. I deliberately split them across two different projects instead of mixing all four tools into one — this project is the BigQuery/SQL/Looker Studio rep, with a dedicated Postgres + Tableau project to follow separately.
An order can contain any number of products, so a fixed set of item columns doesn't hold up. Storing line items as a JSON structure — in both Postgres and the BigQuery tables — keeps the schema stable regardless of how many products are in a given order.